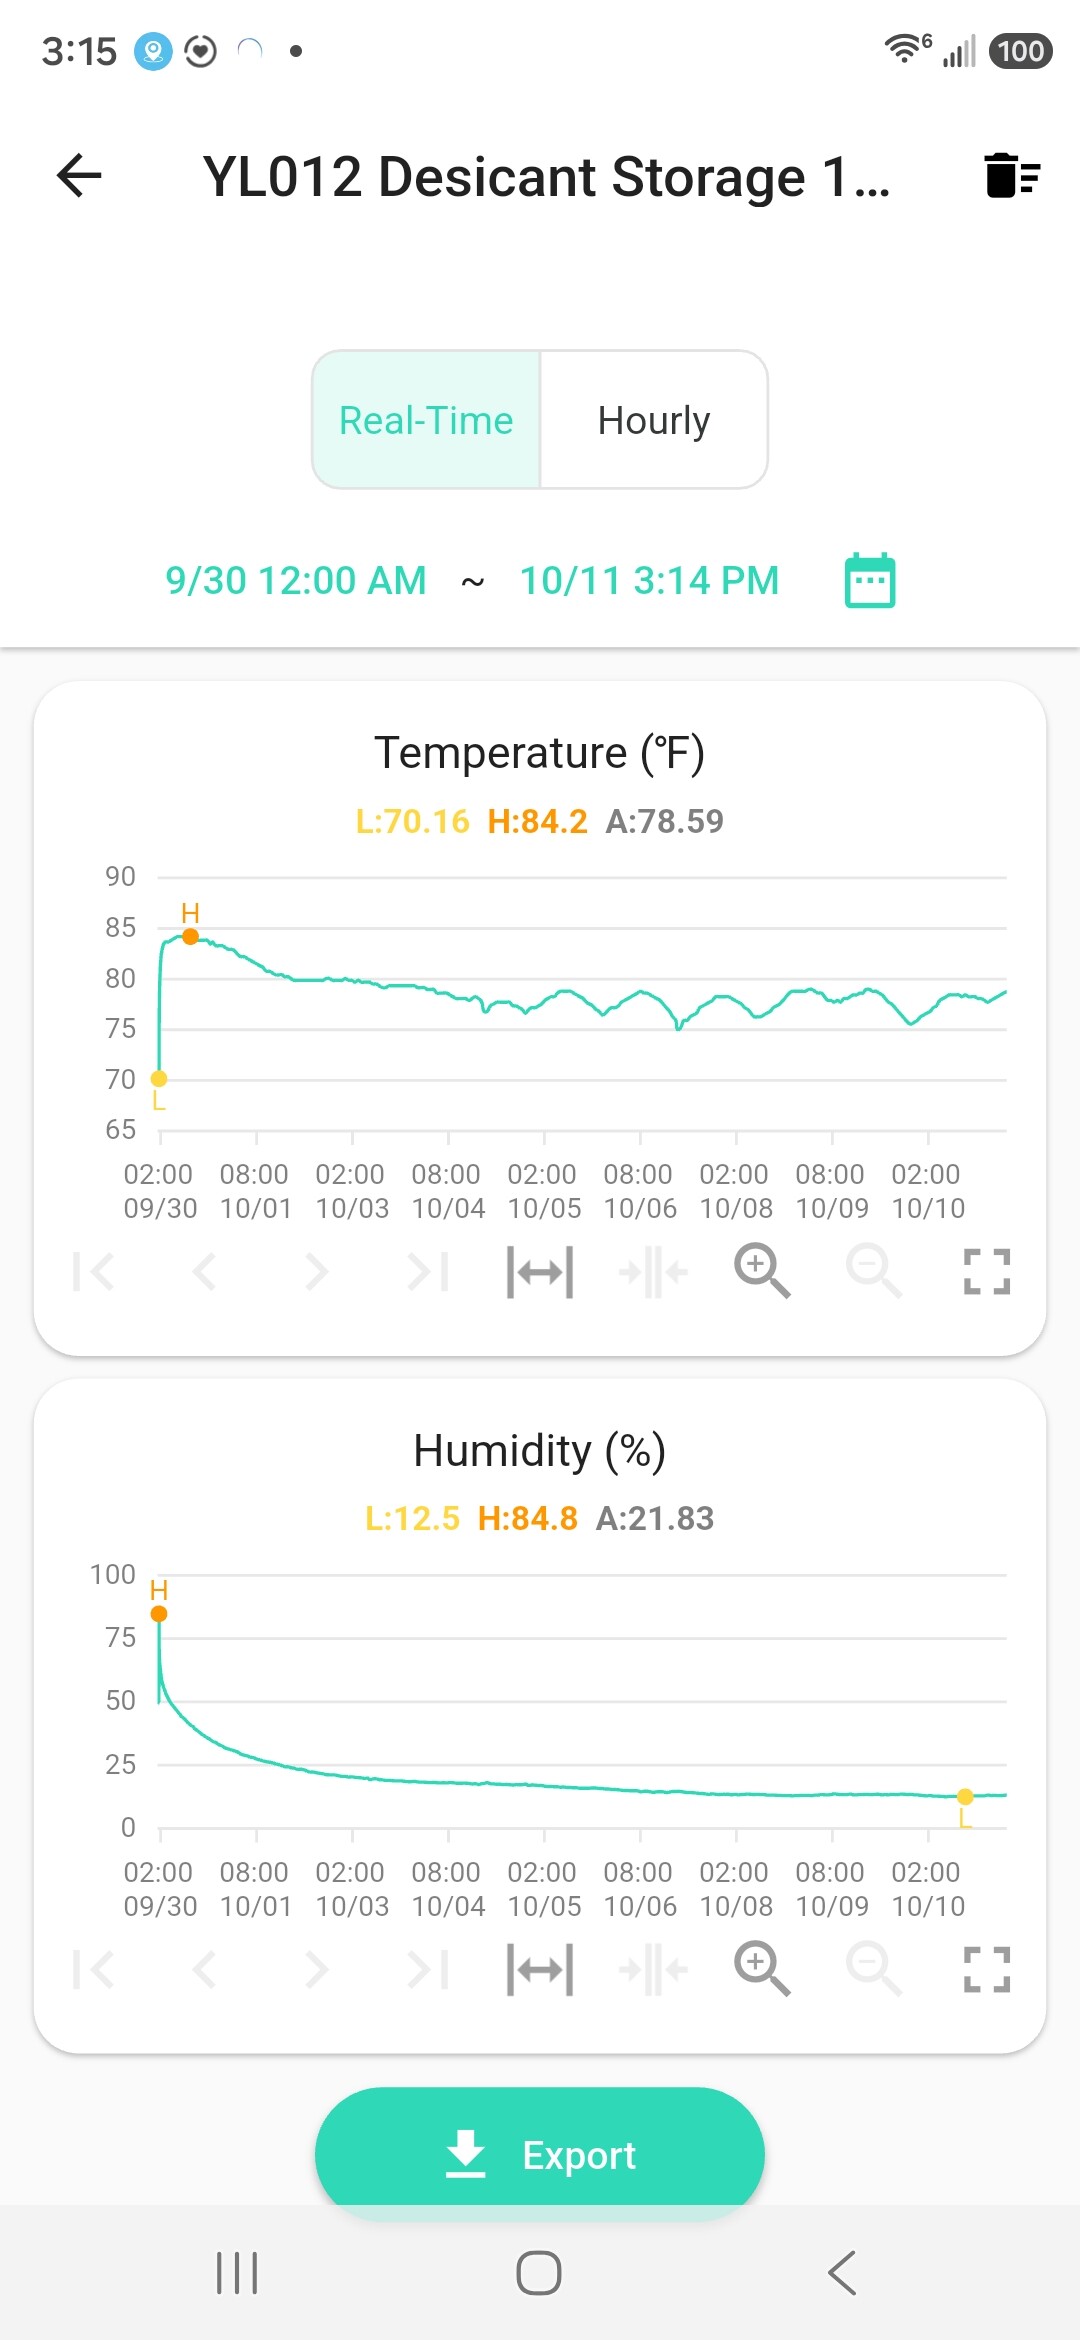
If it’s still in operation I’d be especially interested in seeing the sensor settle to low RH and data collection after that to be able to see how it settles.
But I’m really not worried about the slow response at low RH because it still responds fast getting to around 10% and I don’t have a fan in my testing yet. It’s just those last percentage points are slow.
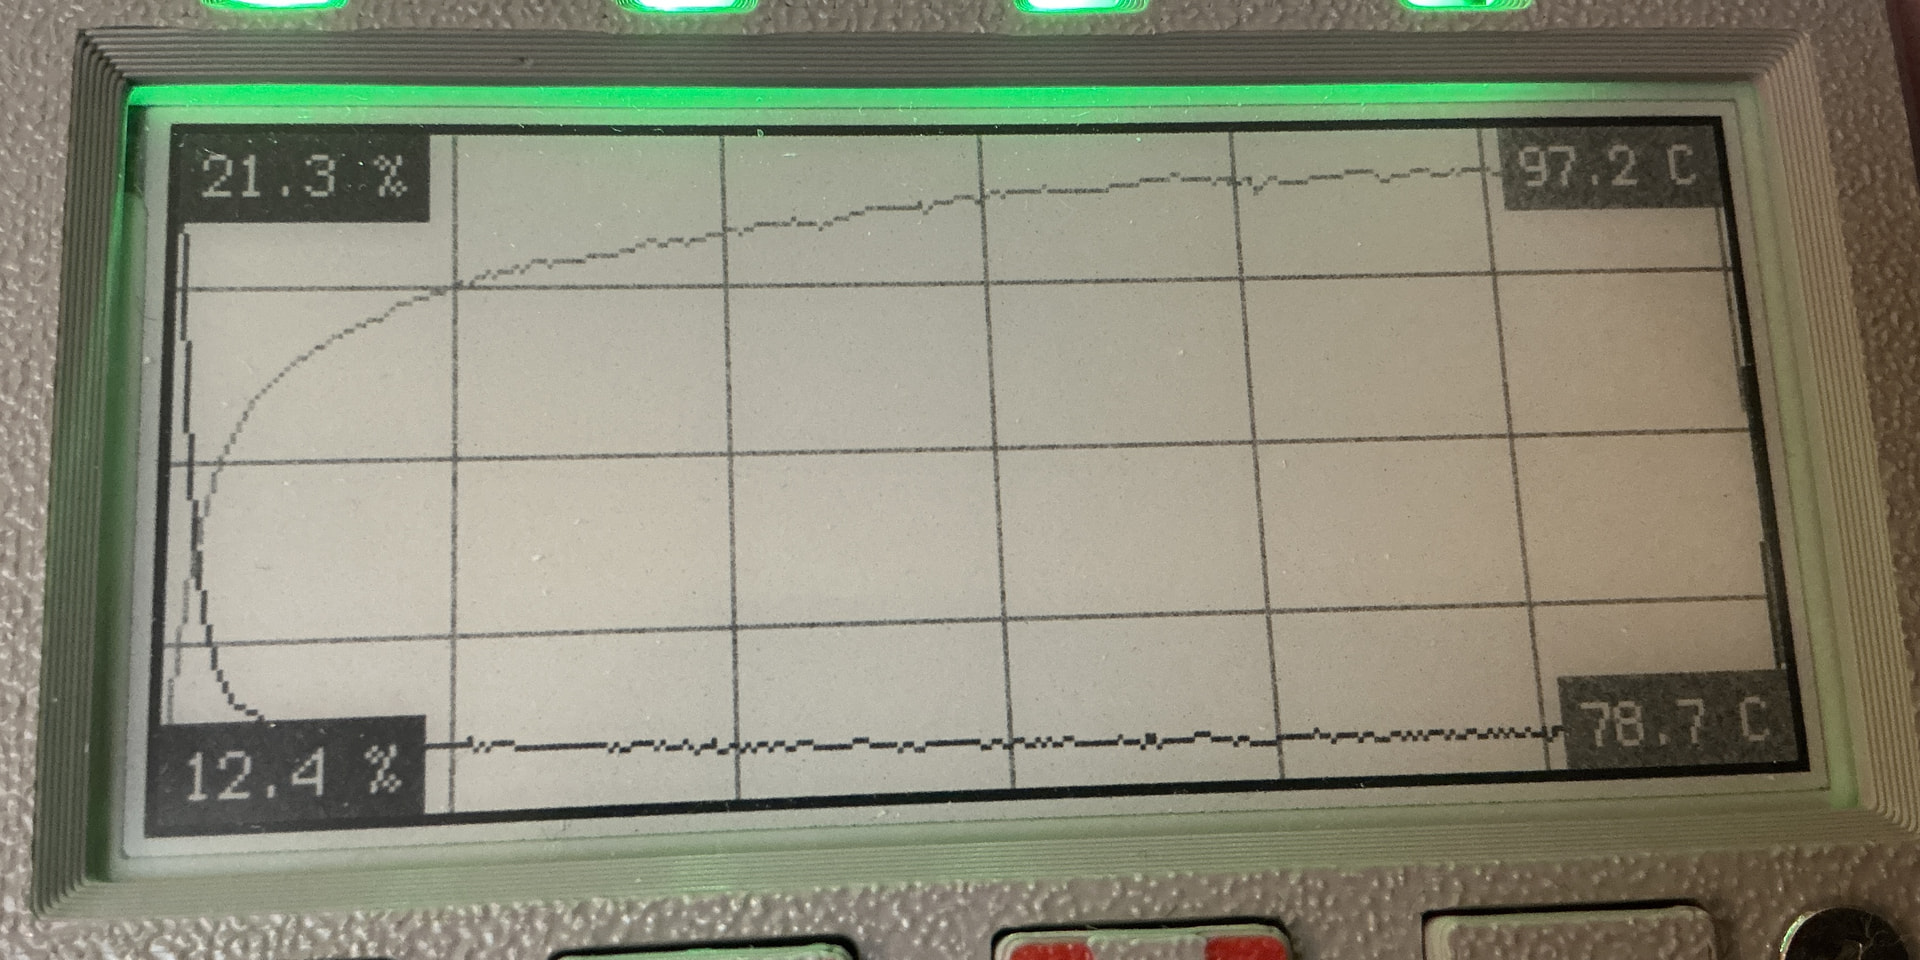
This isn’t the last few percents on RH but is the trip from a reduced ambient down to 12.4% RH from turning on the heater. The x axis is about one minute total in this one but you can see how much the humidity mirrors the temperature. These sensors do respond pretty quick to bigger changes and at higher humidity. It’s settling down below 10% where it slows down for me.
I really suspect the big difference is the fan. Maybe kinetics too. Until I get one involved in my testing I don’t think much can be concluded yet from the different behaviors. But also, if your setup wasn’t continuing to collect data for some minutes after the reading appeared to stop changing you would have missed that settling out in the tail. Or you could try the test without the fan running and that would make your test more analagous to the tests I’m running.
Did anyone here win? Normally such contests are such longshots that it’s not worth the bother, but there were few enough entrants and enough payouts that I thought the odds were reasonably decent on this one. I checked my email and… nothing. Not even a Chinese “You lose. How sad for you.” notification.
Thanks! I think it’s going to be somewhat useful. Already it’s gotten really obvious how useful seeing a graph is. The little digital meters are handy and are great for Praki box storage, but for some things, that extra time dimension is really nice to have. These cabinets have a strong time aspect to them with the desiccant regeneration cycle and opening the door to swap spools so it seemed a nice match.
A lot or maybe all of the ones you can buy with bluetooth or wifi connections to a hub and an app can do graphing too. Only thing is not much resolution on mine but not terrible and if anyone really cares about more detail or the actual numbers, it always streams the raw values over the USB port. A Raspberry Pi could easily log/graph/serve the data while powering the MagTag.
100% yes. You need that time series plot to know when your readings asymptote and for tracking very slow declines.
For instance, purely on a lark, I put a TH sensor inside a 54 quart IP68 storage container that’s holding 12kg of desiccant, but where the desiccant is still factory sealed inside its original plastic packaging. RH is still slowly dropping, but it appears to be getting near the point where moisture uptake through the plastic packaging by the desiccant is almost balanced with the rate of moisture ingress through the envelope of the IP68 container.
The measurements were (at least so far) not as decisive as I was hoping, but I suppose the graph maybe (?) suggests the IP68 container is doing a decent job of keeping ambient moisture in the garage out of the container. If instead the measured RH inside the container had rapidly crashed to single digits, then I would have been very impressed indeed.
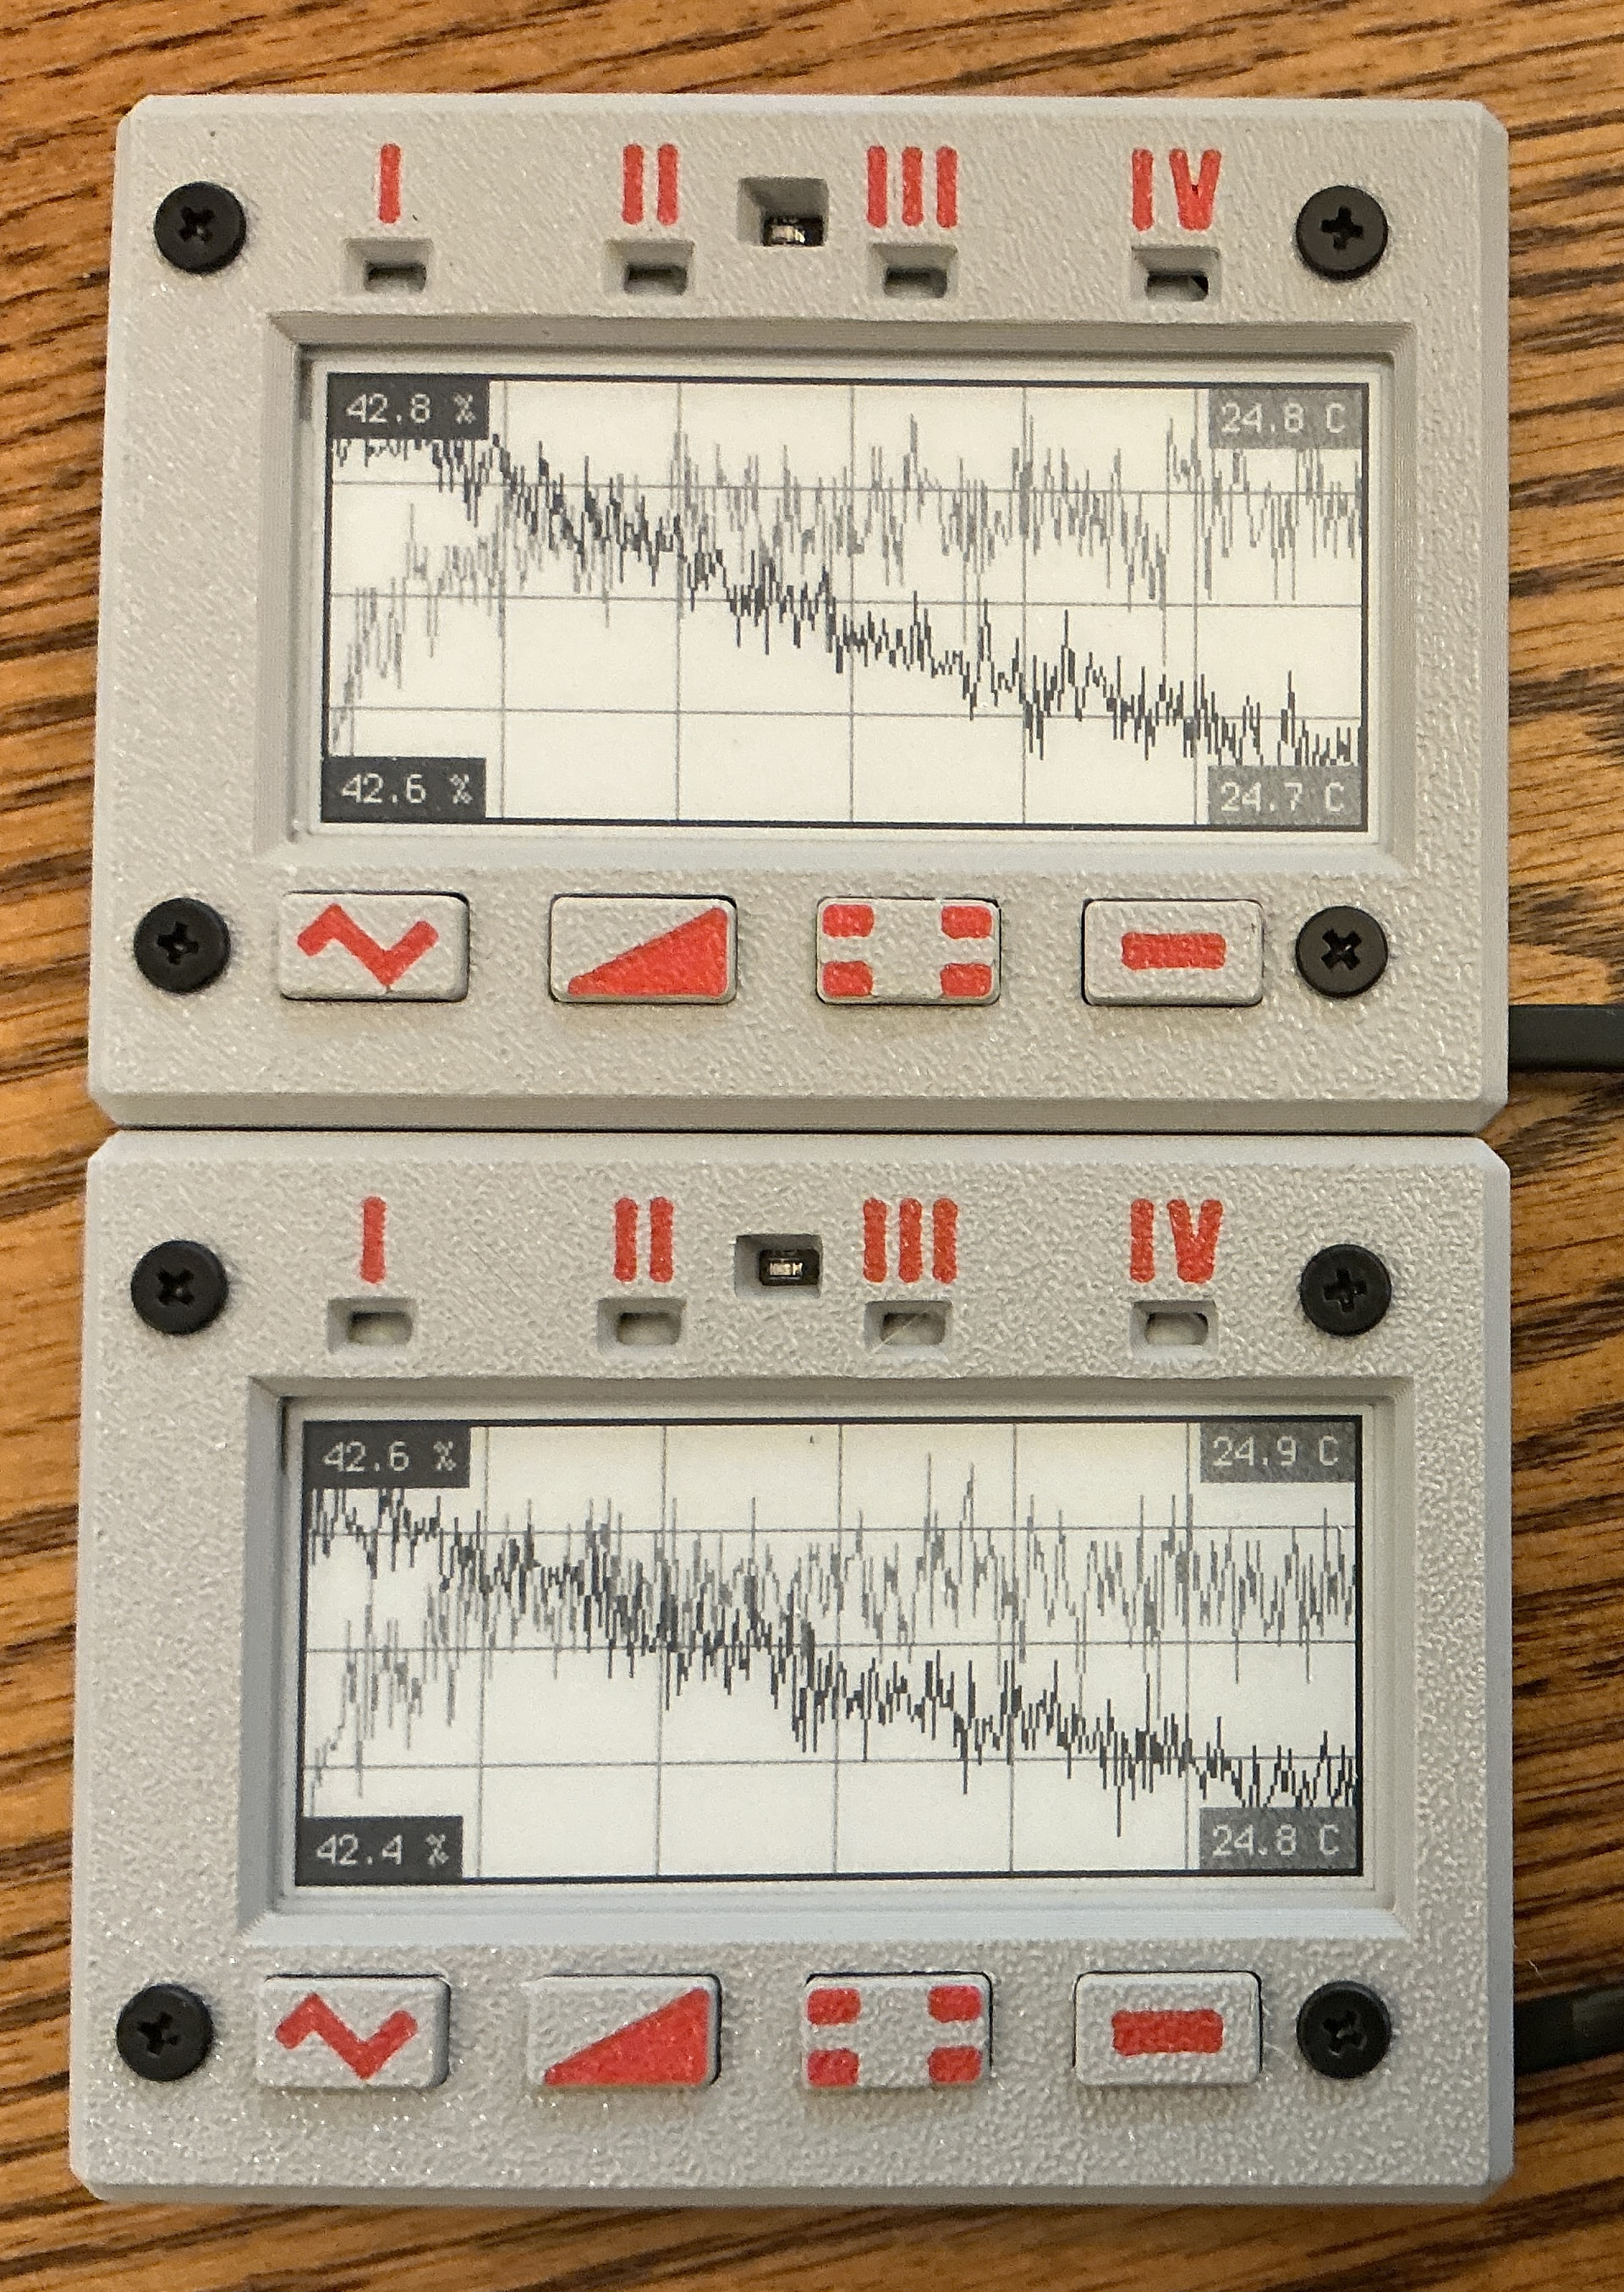
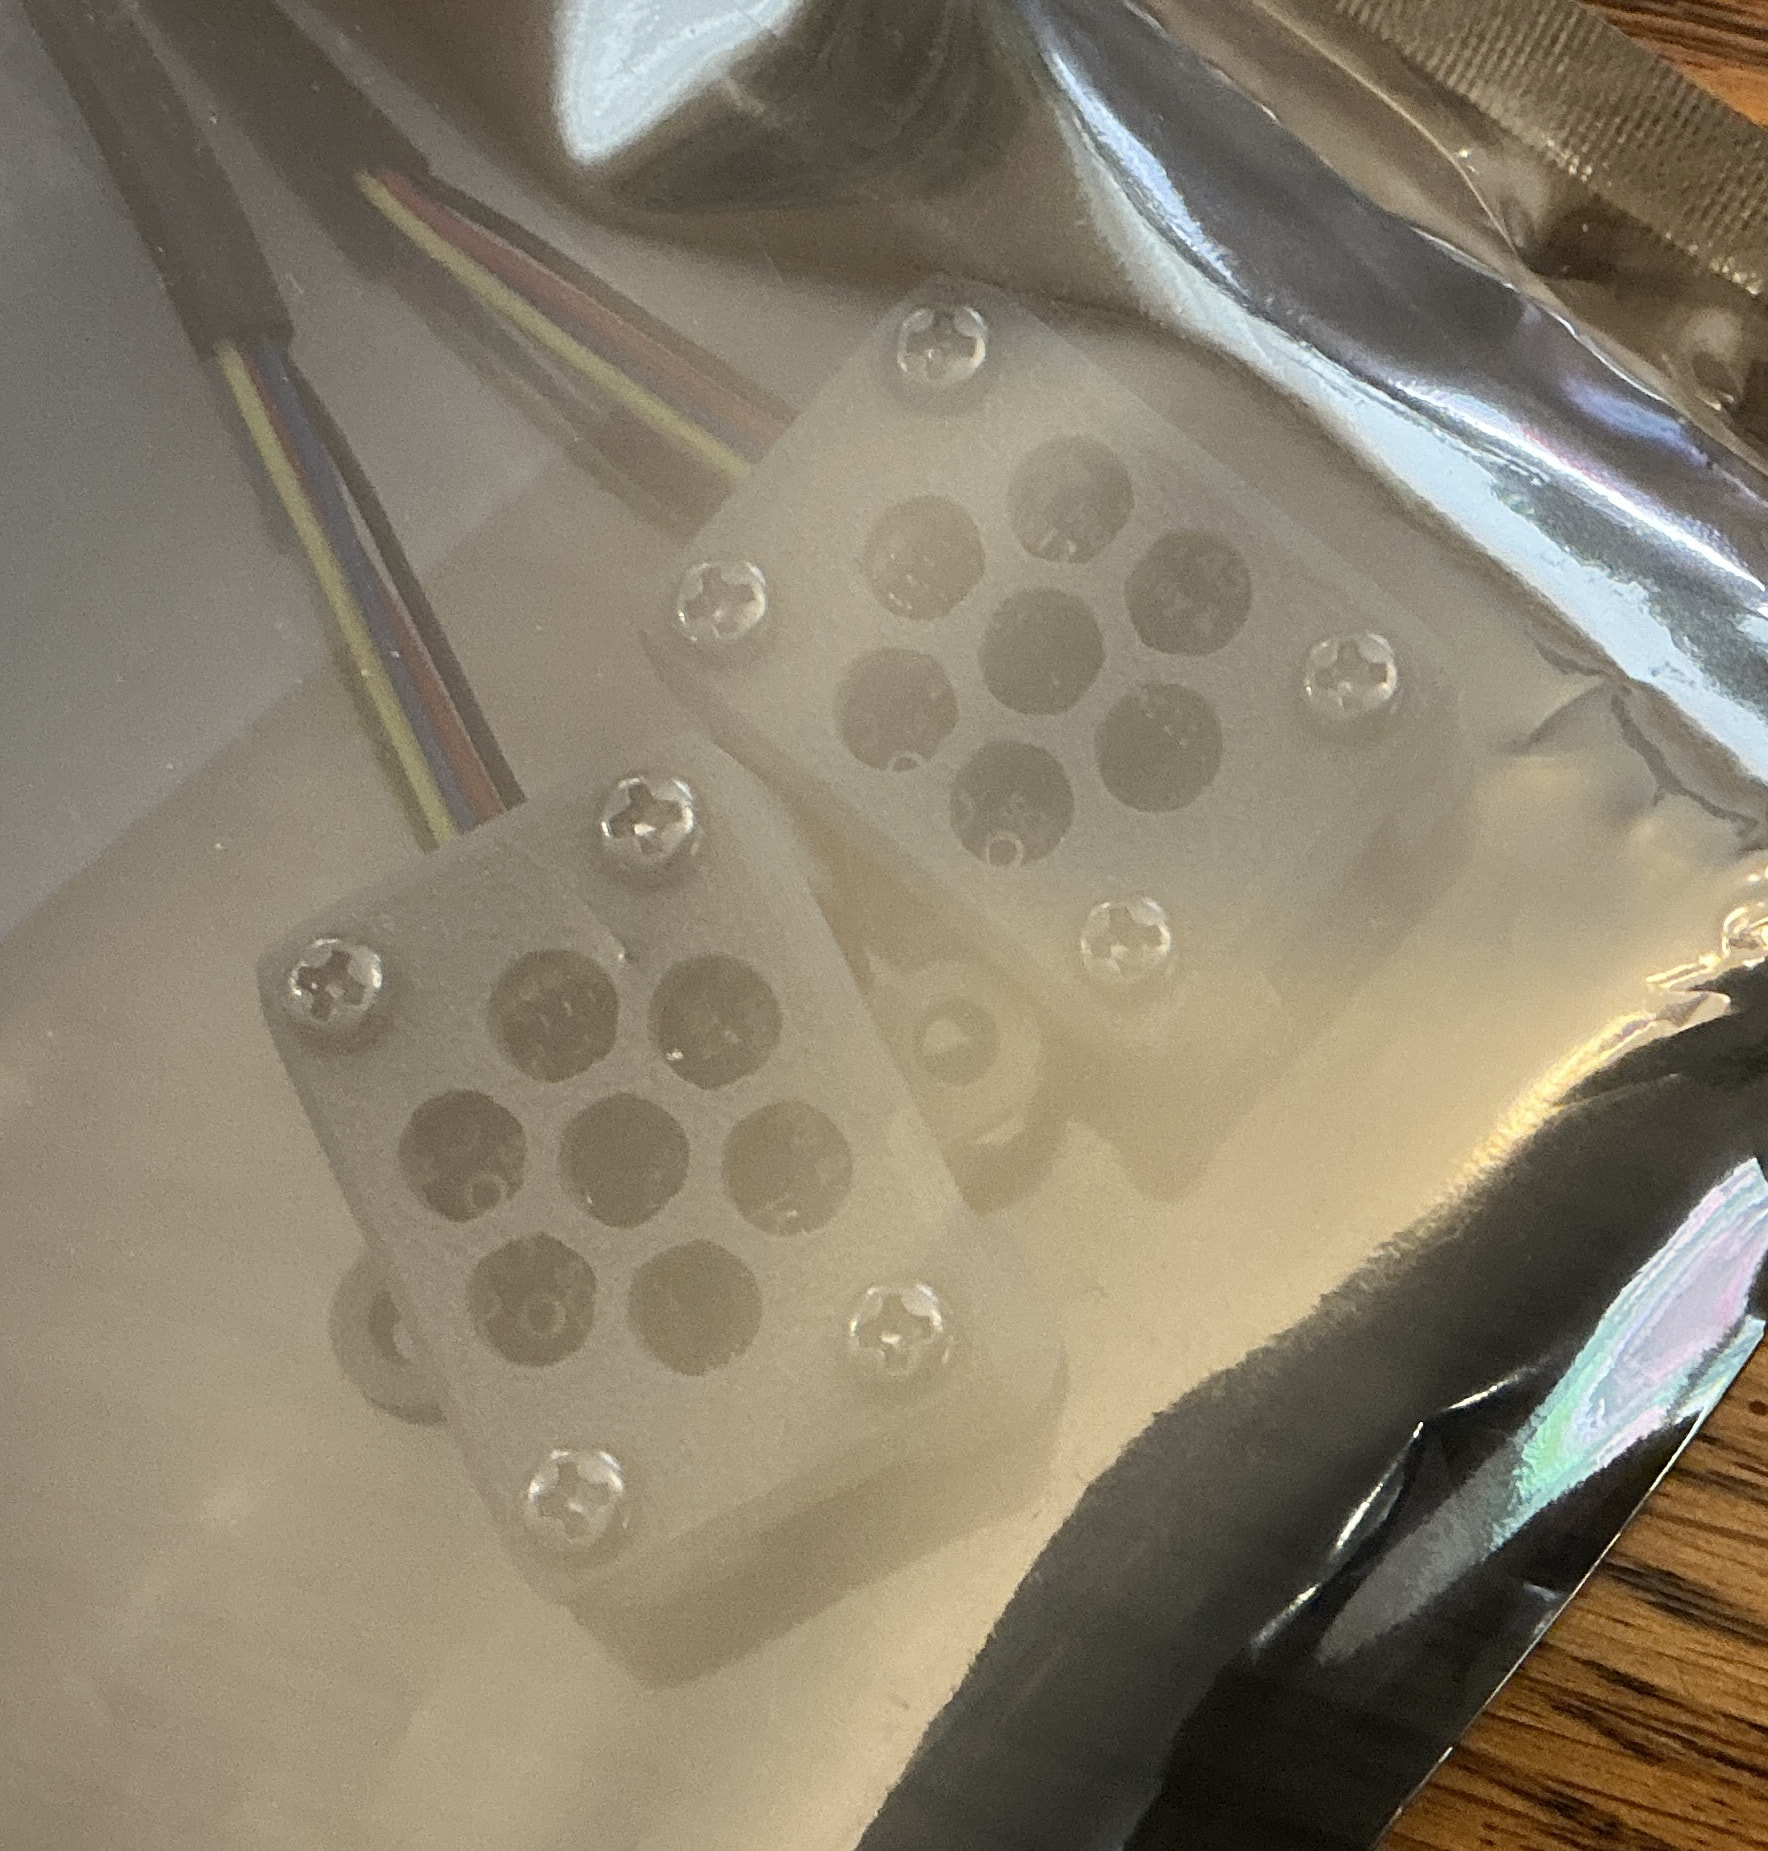
@NeverDie - got the second unit built so can now start comparing things. First comparison was just sensor to sensor. Not bad. Was having a hard time getting traces without features with the sensors exposed and me breathing nearby so stuck them in a shielded ziplock and sealed it as far as the wires would allow. Just a couple of minutes settling and viola. Not entirely featureless but nothing that really interferes with getting the numbers. It’s not an accuracy test since I don’t know the real values but it still looks good.
And the general heating trend with RH decrease during the measurement period is a feature I’ve seen since I got this working. I think taking measurements is affecting the sensor so need to get that sorted. It’s not a strong effect but it seems real so might as well get rid of it. Should just be a slight change to the sampling - add a delay or such where repeated banging doesn’t cause as much heating or lets things recover more. But it’s also just fractions of a single percent. But both units are running the same code and show similar effects.
Silly question, but how do you know which plot is temperature and which is humidity, as they’re both displayed on the same graph? Is one black and the other gray? I can’t tell from the photo whether that’s a visual artifact of the photo angle or the LCD refresh rate, but if that’s what your eyes also see then maybe that’s it.
You got it - I was hoping the labels would give it away since they have the units and match the gray of their respective line but just comparing the two units you can see how the angle changes it. In person it’s much easier. The display is a 4 level display - black, white, and 2 gray shades.
Temperature is lighter gray and the units are switchable between C and F. Humidity is actually dark gray but it looks almost black. You can see the difference between the grays and black in the corners. The border is black and overlaps them both.
It’s easier if you have one in front of you to toggle the units or to look closer at the screen.
or the LCD refresh rate
It’s actually e-paper that holds the image even with power off. I captured those graphs in my workroom, pulled the USB cables that powered them, and put them on the dining table to photograph them with a nice background.
When powered, the LEDs are lit as a red, yellow, green bargraph you can see in one of the photos above. To span 2 days the unit grabs a data point every 10 minutes (which is why the average or max choice of what you plot) but is sampling the environment every second and updating that bargraph with humidity levels to get a more immediate display.
Gathering 10 samples and averaging them but that’s when it is monitoring humidity. Those graphs in the twins photo above were with no signal averaging. Just grabbing samples to fill the arrays, scaling the data to fit in the display’s pixels, and graphing them.
and on the positive side they have a very crisp display, but I had one go dead on me, and there was no visual indication that it had done so, and because it was in a cereal container with a filament, and because I have many such containers, I didn’t recognize the failure until long after the fact. The still frozen display indicated enough battery power, so either it read its own voltage wrong, or there was something else that did it in. Unfortunately, it uses a less common CR2450 battery, so I didn’t have a spare on hand to determine whether it was low battery or something else. Anyhow, I just mention it here, because if it was battery failure, it would be self-evident in an LCD display (blank screen). The point being: I wish it had had some kind of visual heartbeat (like maybe a blinking led, which in itself doesn’t consume much power) so I could have recognized the problem earlier. Food for thought. I have an inkbird CO2 sensor with an e-ink display, and it never gave me any problems. Same with an Airthings view plus air quality monitor. So when they work, they work great.
I don’t understand the level of excitement around the FilaDC i10. Its a self-regenerating drybox that costs $180 to store 10 spools of filament. For that much money, I can build a cereal box storage system (including the cost of desiccant and printing desiccant holders) that holds 30 spools of filament. The only downside of the cereal box system is that I occasionally have to renew the desiccant by drying it in my oven. Considering that cereal box tupperware and desiccant don’t wear out or unexpectedly fail while also costing 1/3 the price, its clear winner for me. I’d much rather invest the saved money in another AMS or a filament dryer.
The way I have my software set up is the first three buttons from the left each force a redraw and there’s no missing a redraw. Also, I didn’t set this up to use a battery. It could use a battery but I didn’t include space for the battery.
The e-ink/e-paper displays do have a lifetime and do wear barring outright failure. In this application and running continuously at the default sample rate it should last around 10 years. But I haven’t used one like this to know but it’s just going by the display spec.
Actually, the nice thing about the Inkbird was that just before its battery died, it’s final act was to change its display to “CHANGE BATTERY”. That was a thoughtful design and a very kind gesture to the user.
I can’t speak for others but for me it’s that I don’t have the tools or other bits to build my own from scratch. I’d love a shop and the space for the tools to build the kind of cabinet I’d want but don’t have either. I’d be paying extra to get stock cut. All the parts would be a significant fraction of the cost of the i10. And it makes a quick access filament cache that I won’t have to mess with to keep dry. For me it makes sense but I didn’t price it all out.
When you get yours built, please post the details. I already use a cereal box storage system and am looking forward to reducing the maintenance.